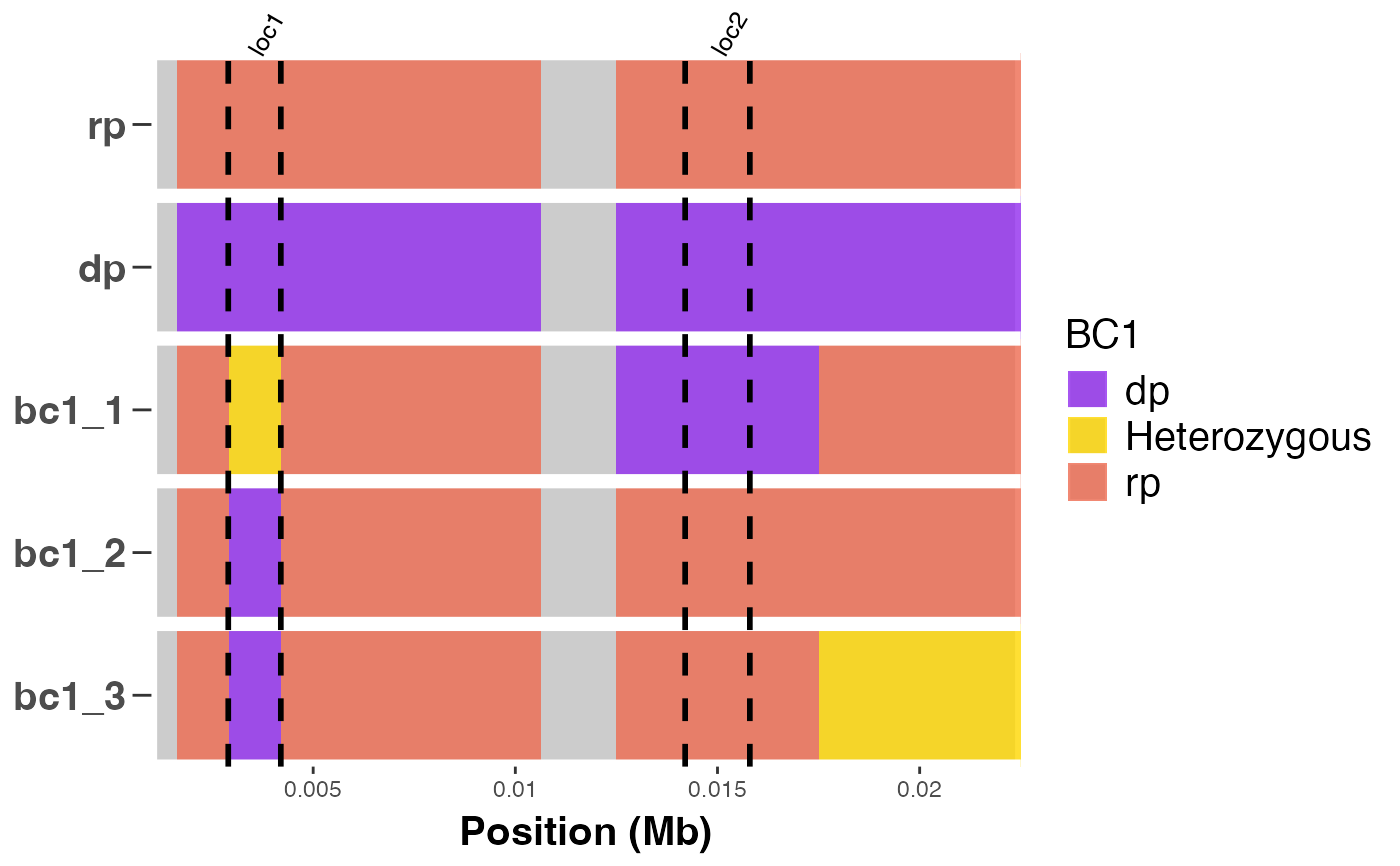
Adds two vertical dashed lines to mark the start and end positions of each locus (e.g., gene or QTL) on a background genotype heatmap, and places a single label at the midpoint between the two positions.
Usage
cross_qc_annotate(
  x,
  map_file,
  snp_ids = "snpid",
  chr = "chr",
  chr_pos = "pos",
  parents,
  trait_pos = NULL,
  group_sz = nrow(x) - 2,
  pdf = FALSE,
  filename = "background_heatmap",
  legend_title = "Heatmap_key",
  col_mapping,
  col_labels,
  panel_fill = "grey80",
  panel_col = "white",
  alpha = 0.9,
  text_size = 12,
  text_scale_fct = 0.5,
  label_offset = 0.5,
  width = 9,
  height = 6.5
)
Arguments
- x
A numeric matrix with marker IDs as columns and sample IDs as row names.
- map_file
A data frame of map file consisting of SNP IDs and their chromosome numbers and positions as columns.
- snp_ids
A character value indicating the column name for marker IDs in
x.- chr
A character value indicating the column name for chromosome IDs in
x.- chr_pos
A character value indicating the column name for chromosome positions in
x.- parents
A character vector of length = 2 for the IDs of parents.
- trait_pos
A list object where the components correspond to the chromosome number, start and end positions of trait loci to annotate on the heapmap.
- group_sz
A positive integer value indicating the batch size for progenies to include in heatmap.
A logical value indicating whether to save plot as a pdf graphic device when TRUE or output plot in R when FALSE.
- filename
A character value for path or file name for saving pdf.
- legend_title
A character value for specifying plot legend title.
- col_mapping
A character vector of length = 6 for heatmap color mapping.
- col_labels
A character vector of length = 6 for labels corresponding to the color mapping.
- panel_fill
A character value for setting the panel background fill color.
- panel_col
A character value for setting the panel background border color.
- alpha
A numeric value between 0 and 1 for modifying the opacity of colors.
- text_size
A numeric value for setting text size.
- text_scale_fct
A numeric value for scaling text size. The default value is `50%` of the defined text size.
- label_offset
A numeric value indicating the position of the trait loci text labels on the heatmap. It is positioned on the donor parent by default.
- width
A numeric value for the width of pdf device.
- height
A numeric value for the height of pdf device.
Examples
# \donttest{
# example code
library(panGenomeBreedr)
# Create a numeric matrix of genotype scores for 10 markers and 5 samples
num_dat <- matrix(c(rep(1, 10), rep(0, 10),
                    1, 1, 0.5, 1, 1, 1, 1, 1, 0, 1,
                    1, 1, 0, 1, 1, 1, 1, 1, 1, 1,
                    1, 1, 0, 1, 1, 1, 1, 1, 1, 0.5 ),
                  byrow = TRUE, ncol = 10)

rownames(num_dat) <- c('rp', 'dp', paste0('bc1_', 1:3))
colnames(num_dat) <- paste0('S1', '_', c(floor(seq(1000, 10000, len = 8)),
                                         15000, 20000))

# Get map file by parsing SNP IDs
map_file <- parse_marker_ns(colnames(num_dat))

# Annotate a heatmap to show QTL positions with vertical lines
cross_qc_annotate(x = num_dat,
                map_file = map_file,
                snp_ids = 'snpid',
                chr = 'chr',
                chr_pos = 'pos',
                parents = c('rp', 'dp'),
                list(loc1 = c(chr = 1, start = 2900, end = 4200),
                loc2 = c(chr = 1, start = 14200, end = 15800)),
                text_scale_fct = 0.3,
                group_sz = 3L,
                pdf = FALSE,
                legend_title = 'BC1',
                alpha = 0.8,
                text_size = 15)
#> $Batch1

#>

# }
#>
# }