Visualize genotype backgrounds with optional QTL annotations.
Source:R/utils.R
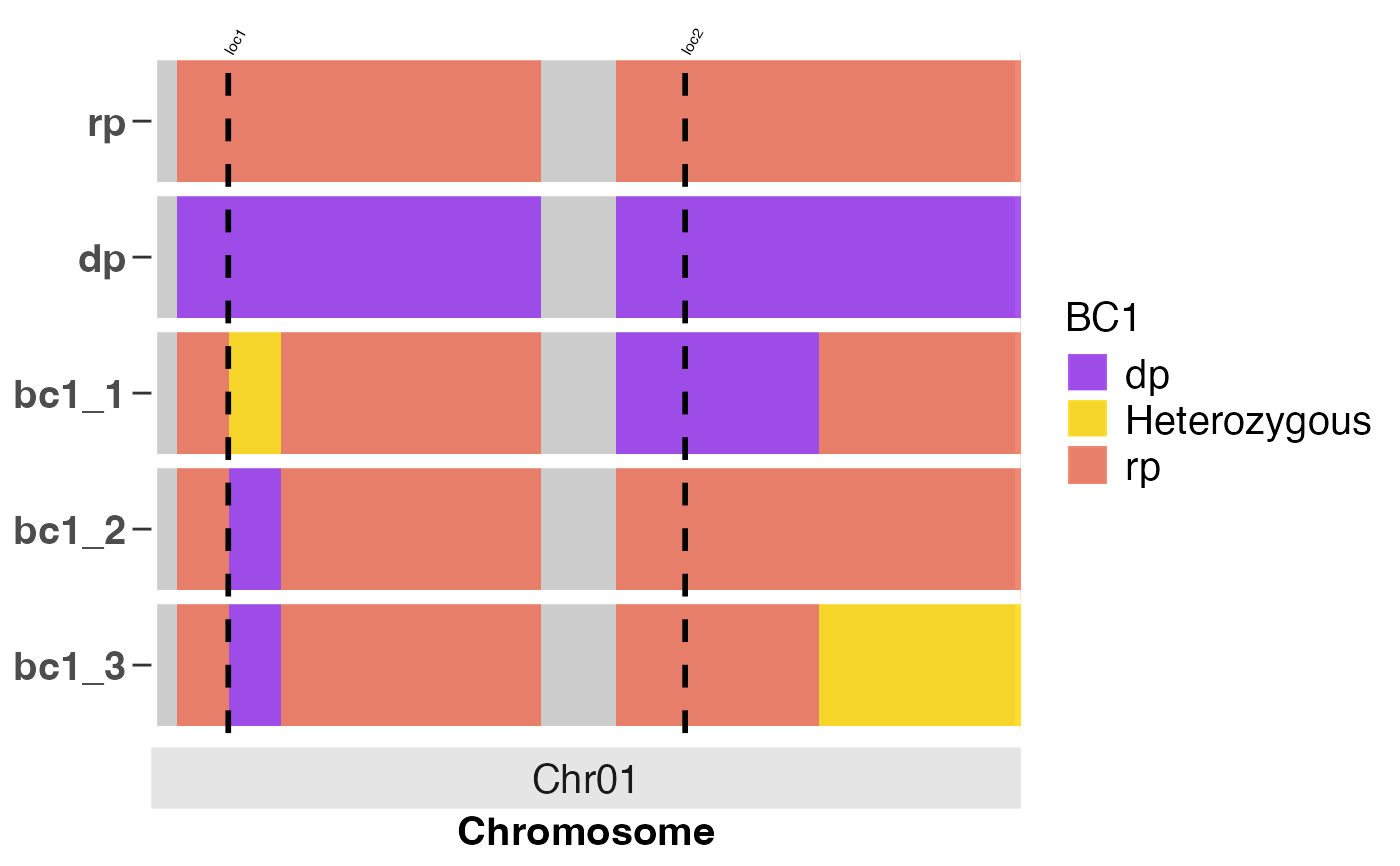
cross_qc_heatmap2.RdCreate a heatmap to compare the genetic backgrounds of genotypes or breeding lines across chromosomes, with optional annotation of known QTL regions. The function supports highlighting trait loci with vertical dashed lines and top-aligned, rotated labels for clear interpretation.
Usage
cross_qc_heatmap2(
  x,
  map_file,
  snp_ids = "snpid",
  chr = "chr",
  chr_pos = "pos",
  parents,
  trait_pos = NULL,
  group_sz = nrow(x) - 2,
  pdf = FALSE,
  filename = "background_heatmap",
  legend_title = "Heatmap_key",
  col_mapping,
  col_labels,
  panel_fill = "grey80",
  panel_col = "white",
  alpha = 0.9,
  text_size = 12,
  text_scale_fct = 0.5,
  label_offset = 0.5,
  width = 9,
  height = 6.5
)
Arguments
- x
A numeric matrix with marker IDs as columns and sample IDs as row names.
- map_file
A data frame of map file consisting of SNP IDs and their chromosome numbers and positions as columns.
- snp_ids
A character value indicating the column name for marker IDs in
x.- chr
A character value indicating the column name for chromosome IDs in
x.- chr_pos
A character value indicating the column name for chromosome positions in
x.- parents
A character vector of length = 2 for the IDs of parents.
- trait_pos
A list object where the components correspond to the chromosome number, start and end positions of trait loci to annotate on the heapmap.
- group_sz
A positive integer value indicating the batch size for progenies to include in heatmap.
A logical value indicating whether to save plot as a pdf graphic device when TRUE or output plot in R when FALSE.
- filename
A character value for path or file name for saving pdf.
- legend_title
A character value for specifying plot legend title.
- col_mapping
A character vector of length = 6 for heatmap color mapping.
- col_labels
A character vector of length = 6 for labels corresponding to the color mapping.
- panel_fill
A character value for setting the panel background fill color.
- panel_col
A character value for setting the panel background border color.
- alpha
A numeric value between 0 and 1 for modifying the opacity of colors.
- text_size
A numeric value for setting text size.
- text_scale_fct
A numeric value for scaling text size. The default value is `50%` of the defined text size.
- label_offset
A numeric value indicating the position of the trait loci text labels on the heatmap. It is positioned on the donor parent by default.
- width
A numeric value for the width of pdf device.
- height
A numeric value for the height of pdf device.
Examples
# \donttest{
# example code
library(panGenomeBreedr)
# Create a numeric matrix of genotype scores for 10 markers and 5 samples
num_dat <- matrix(c(rep(1, 10), rep(0, 10),
                    1, 1, 0.5, 1, 1, 1, 1, 1, 0, 1,
                    1, 1, 0, 1, 1, 1, 1, 1, 1, 1,
                    1, 1, 0, 1, 1, 1, 1, 1, 1, 0.5 ),
                  byrow = TRUE, ncol = 10)

rownames(num_dat) <- c('rp', 'dp', paste0('bc1_', 1:3))
colnames(num_dat) <- paste0('S1', '_', c(floor(seq(1000, 10000, len = 8)),
                                         15000, 20000))

# Get map file by parsing SNP IDs
map_file <- parse_marker_ns(colnames(num_dat))

# Annotate a heatmap to show QTL positions with vertical lines
cross_qc_heatmap2(x = num_dat,
                map_file = map_file,
                snp_ids = 'snpid',
                chr = 'chr',
                chr_pos = 'pos',
                parents = c('rp', 'dp'),
                trait_pos = list(loc1 = c(chr = 1, pos = 2900),
                loc2 = c(chr = 1, pos = 14200)),
                text_scale_fct = 0.5,
                group_sz = 3L,
                pdf = FALSE,
                legend_title = 'BC1',
                alpha = 0.8,
                text_size = 15)
#> $Batch1

#>

# }
#>
# }