Make KASP marker genotyping QC plot.
Usage
kasp_qc_ggplot(
  x,
  FAM = "X",
  HEX = "Y",
  geno_call = "Call",
  color = "Color",
  snp_id = "SNPID",
  blank = "NTC",
  Group_id = NULL,
  scale = FALSE,
  pdf = TRUE,
  width = 6,
  height = 6,
  filename = "kasp_qc",
  expand_axis = 0.5,
  legend.pos.x = 0.6,
  legend.pos.y = 0.75,
  legend.box = "horizontal",
  legend.pos = "inside",
  alpha = 0.5,
  text_size = 12,
  ...
)
Arguments
- x
A list object of KASP genotype calls processed by the `kasp_color()` function.
- FAM
A character indicating the column name for FAM fluorescence coordinates in
x.- HEX
A character indicating the column name for HEX fluorescence coordinates in
x.- geno_call
A character value indicating the column name for KASP genotype calls in
x.- color
A character value indicating the column name for assigned colors in
x.- snp_id
A character value indicating the column name for SNP IDs in
x.- blank
A character value indicating `No Template Controls (NTC)` genotype calls.
- Group_id
A character value for the column ID indicating the predictions of the positive controls in
x.- scale
A logical value indicating whether to scale FAM and HEX axis to values between 0 and 1.
A logical value indicating whether to save plot as a pdf graphic device when TRUE or output plot in R when FALSE.
- width
A numeric value for the width of pdf device.
- height
A numeric value for the height of pdf device.
- filename
A character value for path or file name for saving pdf.
- expand_axis
A numeric value to expand the axes for legend positioning.
- legend.pos.x
A numeric value representing the x coordinate for legend placement.
- legend.pos.y
A numeric value representing the y coordinate for legend placement.
- legend.box
A character value of either `horizontal` or `vertical` legend placement.
- legend.pos
A character value for the position of legend; the default value is `inside`.
- alpha
A numeric value between 0 and 1 for modifying the opacity of colors.
- text_size
A numeric value for setting text size.
- ...
Other valid arguments that can be passed to ggplot2.
Examples
# example code
library(panGenomeBreedr)
# \donttest{
# Assign KASP colors to plates
dat1 <- kasp_color(x = panGenomeBreedr::kasp_dat,
subset = 'MasterPlate',
sep = ':',
geno_call = 'Call',
uncallable = 'Uncallable',
unused = '?',
blank = 'NTC')
#> Marker in Plate SE-24-0392_P01_d2 failed! Check genotype calls.
#> Marker in Plate SE-24-0392_P01_d1 failed! Check genotype calls.
#> Marker in Plate SE-24-0395_P01_d2 failed! Check genotype calls.
#> Marker in Plate SE-24-0395_P01_d1 failed! Check genotype calls.
#> Marker in Plate SE-24-0397_P01_d2 failed! Check genotype calls.
#> Marker in Plate SE-24-0397_P01_d1 failed! Check genotype calls.
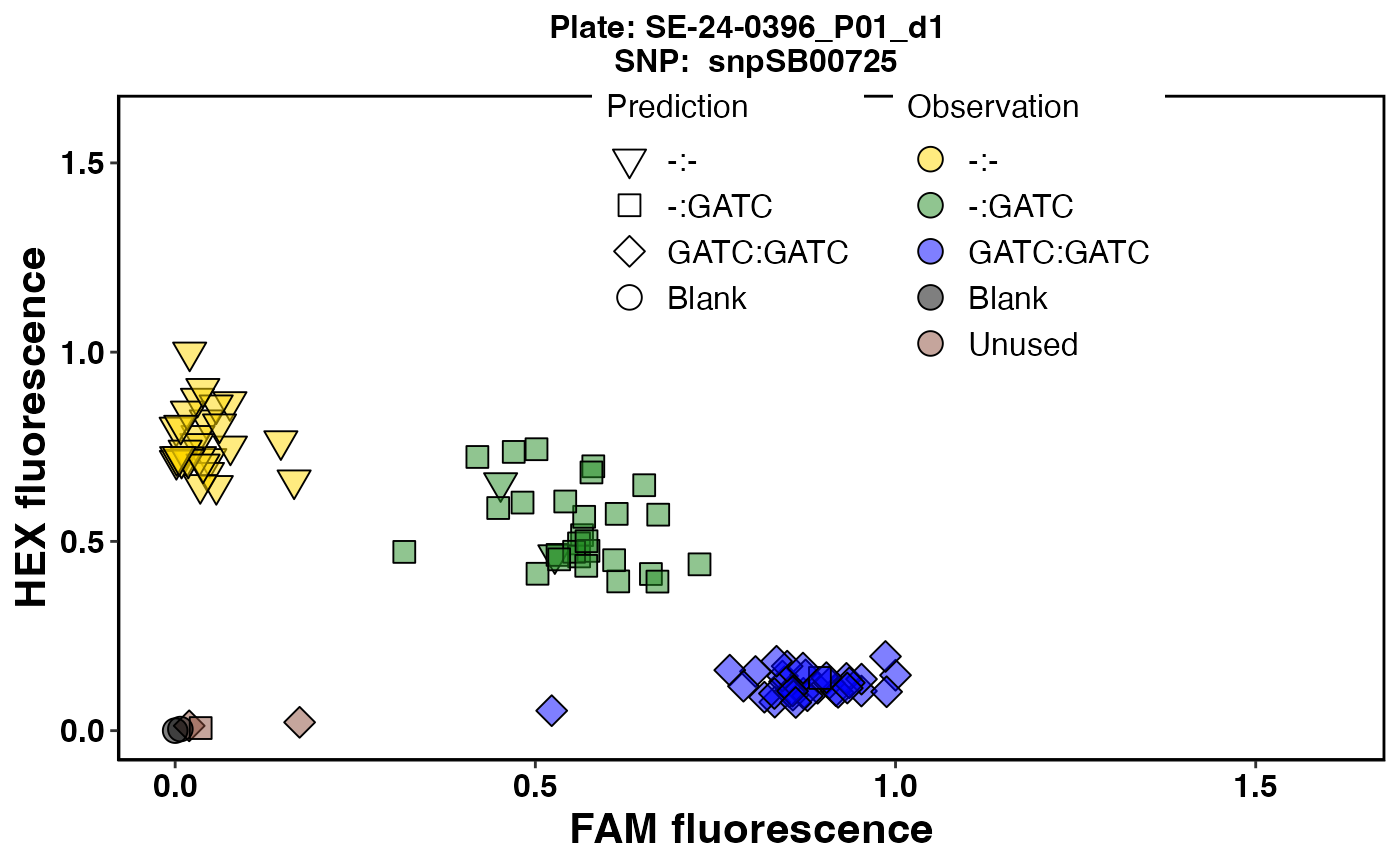
# KASP QC plot for Plate 12
kasp_qc_ggplot(x = dat1[12],
pdf = FALSE,
Group_id = 'Group',
scale = TRUE,
expand_axis = 0.6,
alpha = 0.5,
legend.pos.x = 0.6,
legend.pos.y = 0.8)
#> $`SE-24-0396_P01_d1`
 #>
# }
#>
# }