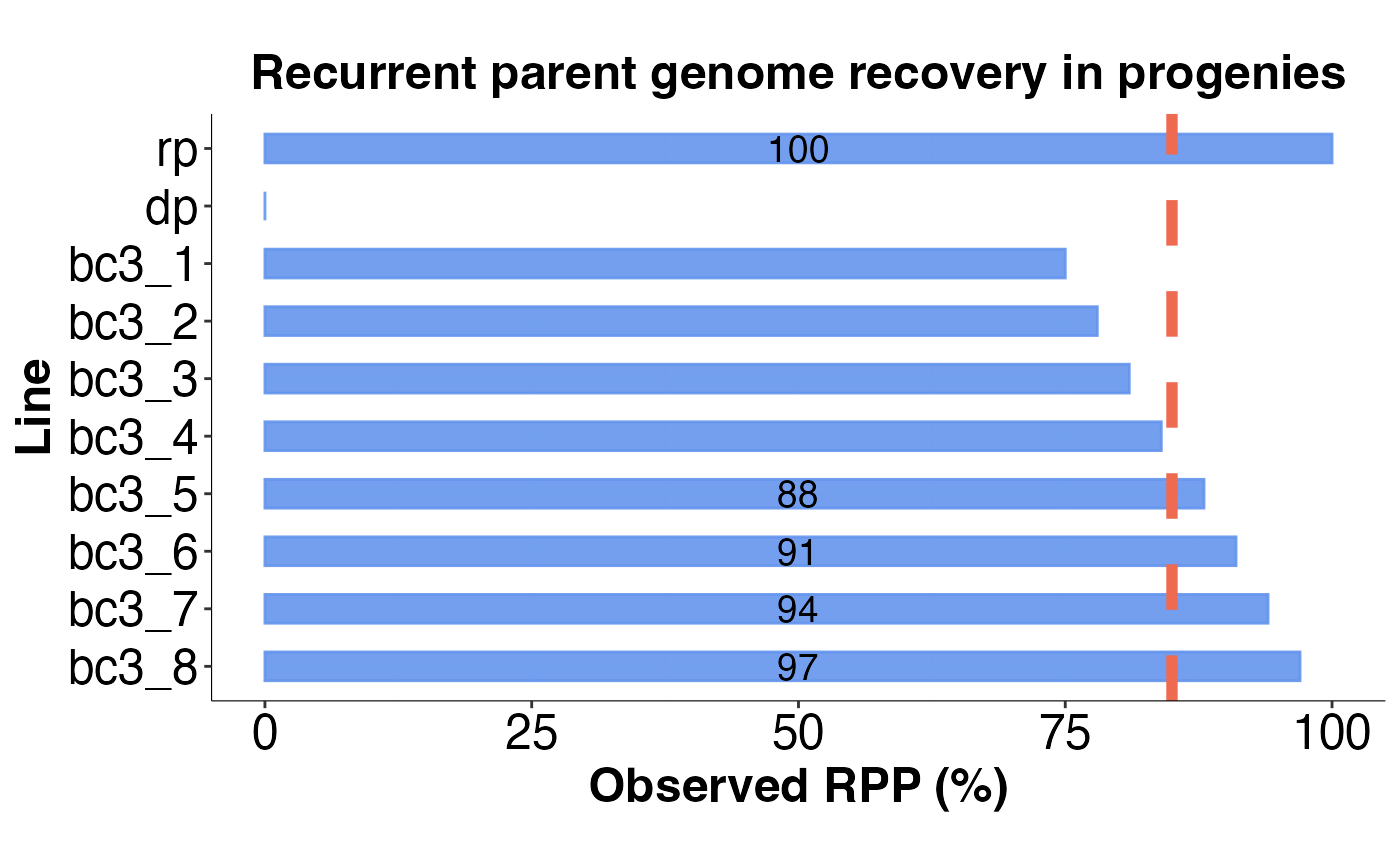
Visualize computed RPP values for BC progenies as a bar plot.
Usage
rpp_barplot(
  rpp_df,
  rpp_col = "total_rpp",
  rpp_sample_id = "sample_id",
  bc_gen = NULL,
  rpp_threshold = NULL,
  thresh_line_col = "coral2",
  show_above_thresh = FALSE,
  text_size = 15,
  text_scale_fct = 0.2,
  alpha = 0.5,
  bar_width = 0.5,
  bar_col = "cornflowerblue",
  aspect_ratio = 0.5,
  pdf = FALSE,
  filename = "rpp_barplot",
  width = 8,
  height = 6
)
Arguments
- rpp_df
A data frame containing the computed RPP values for each BC progeny.
- rpp_col
A character value indicating the column name of RPP values in
rpp_df.- rpp_sample_id
A character value indicating the column name of progeny IDs in
rpp_df.- bc_gen
An integer value indicating the BC generation for the progenies
rpp_df. This value is used to compute the nominal RPP values, ifrpp_threshold`= NULL`.- rpp_threshold
A numeric value between 0 and 1 indicating the RPP threshold for selecting BC progenies.
- thresh_line_col
A character value indicating the color of the threshold line.
- show_above_thresh
A logical value indicating whether to subset
rpp_dfto show only lines that have RPP values greater or equal to the desired RPP threshold. Only the subset lines will be shown on the plot.- text_size
A numeric value for setting text size.
- text_scale_fct
A numeric value for scaling text size. The default value is `20%` of
text_size.- alpha
A numeric value between 0 and 1 for modifying the opacity of colors.
- bar_width
A numeric value for setting the width of plot bars.
- bar_col
A character value for setting the color to fill plot bars.
- aspect_ratio
A numeric value for setting the aspect ratio of the bar plot.
A logical value indicating whether to save plot as a pdf graphic device when TRUE or output plot in R when FALSE.
- filename
A character value for path or file name for saving pdf.
- width
A numeric value for the width of pdf device.
- height
A numeric value for the height of pdf device.
Examples
# \donttest{
# example code
library(panGenomeBreedr)

# Observed RPP values
rpp_df <- data.frame(sample_id = c('rp', 'dp', paste0('bc3_', 1:8)),
                     rpp = c(1, 0, round(seq(0.75, 0.97, len = 8), 2)))

# Generate bar plot for RPP values
rpp_barplot(rpp_df,
            rpp_col = 'rpp',
            rpp_threshold = 0.85,
            text_size = 18,
            text_scale_fct = 0.1,
            alpha = 0.9,
            bar_width = 0.5,
            aspect_ratio = 0.5,
            pdf = FALSE)

# }
# }